Image embeddings outperform a cell count only in wells a knockout has already thinned
Cell Painting1 and its large public successors, including RxRx32,3 and the JUMP genetic map16, have made image-based detection of genetic perturbations routine, though only a subset of perturbations yields a detectable profile16,17. An anomaly detector trained only on normal wells could flag the few that matter without needing a label for every phenotype in advance11. The promise is easy to overstate. A knockout that stops cell division leaves fewer cells in the well, and almost any image score will notice that; cell density shapes cellular phenotypes generally10, and Seal and colleagues recently showed that counting cells alone matches many image-based bioactivity benchmarks, recommending a cell-count baseline for any image-based model9. Technical variation across plates and experiments is a known dominant signal in these data6,7,8, which is why evaluation frameworks compare perturbations with same-plate controls18. None of these points is new here. What we add is a measurement under pre-registered protocols15 with plate-level intervals14: for this design and dataset, how much of a global AUC is cell count and experiment, as the shortcut-learning literature would predict13, and what is left once both are matched.
RxRx3 images six fluorescent channels, a variant of Cell Painting1,2. Hoechst, the DNA stain, is excited in the UV at about 350 nm; the other five are excited in the visible range. We gave the nuclear channel its own detector, a convolutional autoencoder scored by reconstruction error, and covered the rest with an Isolation Forest5 over the pre-computed OpenPhenom embeddings released with the dataset3, from a masked-autoencoder model of the kind described by Kraus and colleagues4, fusing the two scores by averaging their ranks. One caveat surfaced while the first protocol was being written: OpenPhenom embeds all six channels, Hoechst included, so the embedding branch was never UV-free, and the fusion question became narrower — does a Hoechst-only autoencoder add anything to a model that has already seen Hoechst? Four protocols were fixed in advance and each test set was scored once (Box 1, Methods).
Reconstruction error scores depleted wells as more normal, not less
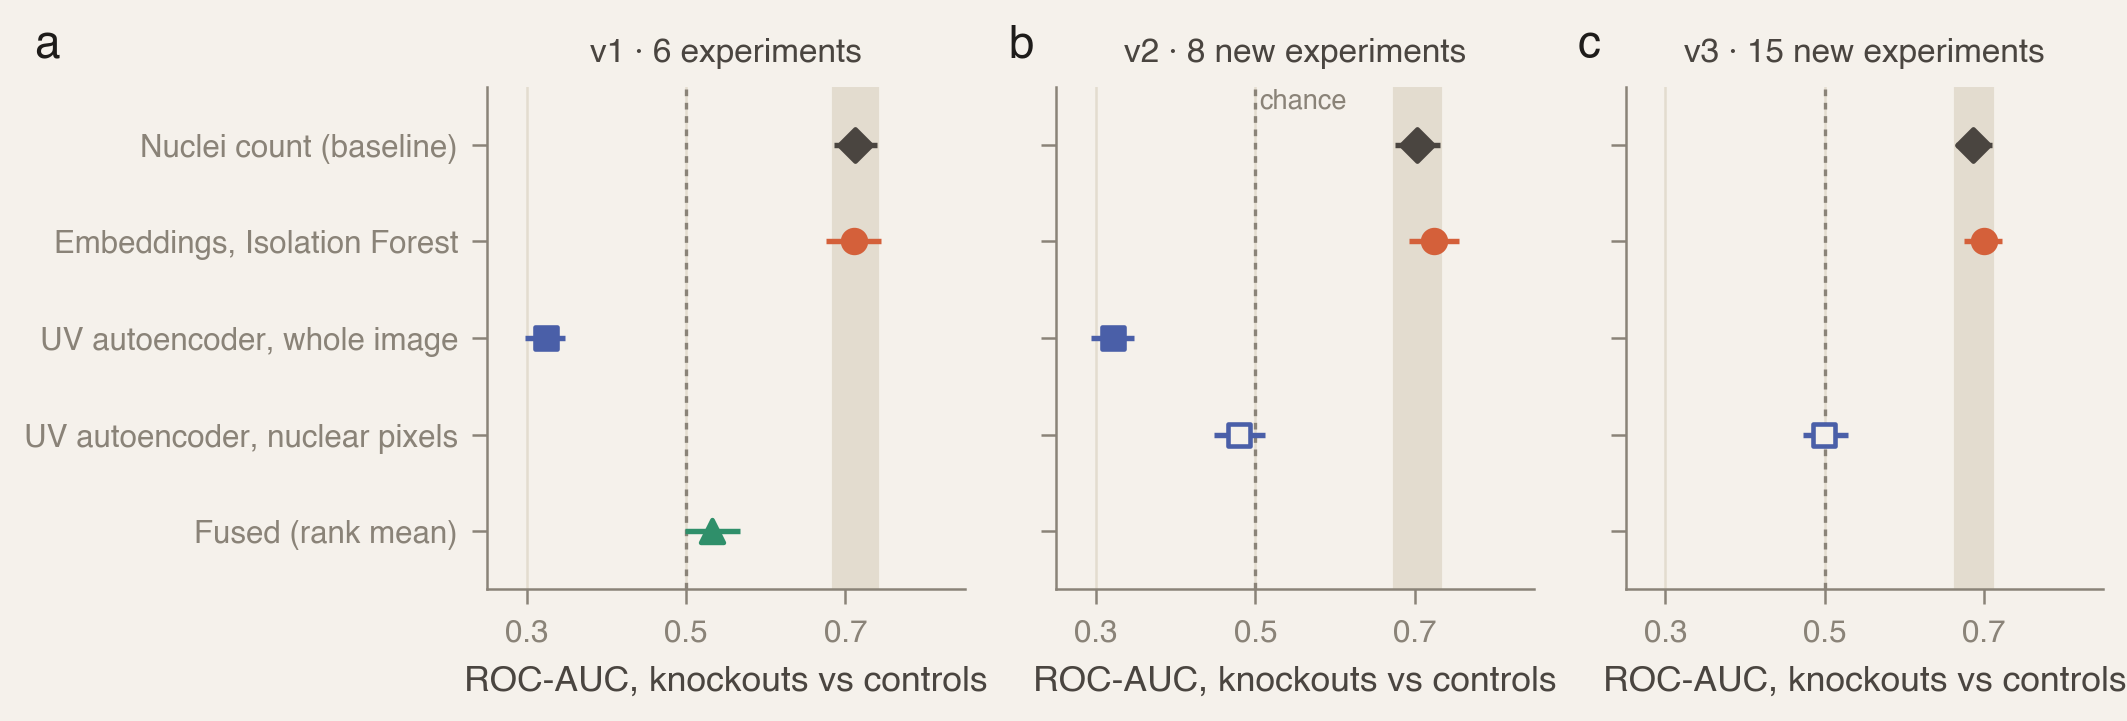
On the first held-out set — 848 wells on 54 plates from six experiments, scored once (Methods) — the autoencoder reached an AUC of 0.324 (Table 1, Fig. 1a), well below chance: knockout wells reconstructed better than controls. Fewer nuclei leave more empty background, which an autoencoder reproduces easily, so “higher error means more anomalous” fails for exactly the phenotype it was meant to catch. Deep generative models are known to score simpler inputs as more normal12; control-trained anomaly methods that work on Cell Painting score features, not pixels11. The protocol fixed the direction before scoring, so the score was not flipped afterwards. It carries signal, but it is not an anomaly detector as designed.
Fusion inherited that failure. Rank-averaging a reversed score with a good one landed near chance at 0.532, 0.179 below the embedding branch alone (95% CI 0.152–0.206) — and this was the comparison the whole design rested on. The embeddings themselves saw about as much as a cell count: overall they tied the baseline, 0.711 against 0.712, better on PLK1 and worse on MTOR. The score distributions show why: the embeddings catch a tail of strongly shifted knockout wells, but most knockouts overlap the controls. The Isolation Forest added nothing over a plain distance to the normal centroid (+0.004, CI −0.001 to +0.009).
Table 1 | First run. ROC-AUC for flagging PLK1 and MTOR knockouts against control wells on six held-out experiments, with 95% intervals from a bootstrap over plates.
| Detector | ROC-AUC (95% CI) | PLK1 | MTOR |
|---|---|---|---|
| Nuclei count (baseline) | 0.712 (0.686–0.740) | 0.787 | 0.638 |
| Embeddings, Isolation Forest | 0.711 (0.676–0.745) | 0.831 | 0.591 |
| Embeddings, centroid distance | 0.707 (0.672–0.741) | 0.825 | 0.589 |
| Fused | 0.532 (0.498–0.568) | 0.559 | 0.505 |
| UV autoencoder | 0.324 (0.297–0.348) | 0.233 | 0.415 |
The written expectation was partly wrong, and it stays in the protocol as written. It predicted near-perfect separation of PLK1 by the embeddings (they reached 0.83), weaker MTOR (true), an autoencoder that mostly tracks cell count (it tracks it inversely), and no gain from fusion (true, and worse than expected).
The failure replicated, and linear regression could not remove the cell count
Two repairs followed from the first result, and both were designed after seeing it. Scoring them on the same held-out experiments would reuse a test set that had already shaped them, so the second protocol scored them once on eight experiments nobody had touched: 1,150 wells, 862 knockouts, 72 plates. The first result replicated: on new experiments the whole-image autoencoder scored in the wrong direction again, and the embeddings tied the cell count again (Table 2, Fig. 1b). Scoring nuclear pixels removed the inversion and left nothing — once empty background could no longer lower the error, the autoencoder sat at chance, 0.22 below the cell count.
Table 2 | Second run. ROC-AUC on eight experiments no earlier run had scored, with 95% intervals from the plate bootstrap.
| Detector | ROC-AUC (95% CI) | MTOR (95% CI) |
|---|---|---|
| Nuclei count (baseline) | 0.703 (0.676–0.731) | 0.615 (0.586–0.645) |
| Embeddings, Isolation Forest | 0.724 (0.693–0.757) | 0.598 (0.554–0.644) |
| Embeddings, cell count regressed out | 0.712 (0.676–0.748) | 0.584 (0.534–0.634) |
| UV autoencoder, nuclear pixels only | 0.480 (0.448–0.512) | 0.499 (0.467–0.532) |
| UV autoencoder, whole image (v1) | 0.321 (0.293–0.348) | 0.424 (0.393–0.453) |
Removing cell count did not remove it. The pre-registered check passed: with cell count regressed out of the embeddings, MTOR knockouts still scored above chance (0.58). But a check made after scoring showed the residualized score still tracked cell count almost as strongly as before (Spearman −0.48, against −0.51), and ranked wells almost exactly as the original did. A linear regression per embedding dimension cannot remove a nonlinear dependence, so that 0.58 cannot be called signal beyond cell count. The control did not do its job, and we report that rather than the pass.
Compared only with controls of matching cell count, the embeddings keep their signal
Regression tried to take cell count out of the score. The third protocol takes it out of the comparison instead: control wells are cut into ten bins by nuclei fraction, and each knockout is compared only with controls in its own bin. Inside a bin, a score that only counts nuclei has almost nothing to work with, so the protocol builds in a check — the cell count itself must score between 0.45 and 0.55, or the bins did not do their job. It was scored once on fifteen more experiments nobody had touched: 2,108 wells on 135 plates, with 1,533 of 1,578 knockouts having a control with a matching count.
The check passed, and the embeddings kept their signal (Table 3). With count matched, the cell count fell to 0.521, as it should. The embeddings held at 0.690, 0.169 above it (95% CI 0.113–0.222), and the subtler MTOR knockouts stayed above chance at 0.579. This is the first argus result a cell count cannot explain. Unmatched, the embeddings tied the count for the third time (Fig. 1c), which is exactly why the earlier runs could not see the difference: a global metric rewards whatever shortcut the data offers13.
Table 3 | Third run. AUC with each knockout compared only against controls in its own nuclei-fraction decile, on fifteen experiments no earlier run had scored, with 95% intervals from the plate bootstrap.
| Detector | Matched AUC (95% CI) | MTOR matched (95% CI) | Unmatched |
|---|---|---|---|
| Embeddings, Isolation Forest | 0.690 (0.651–0.724) | 0.579 (0.540–0.615) | 0.700 |
| UV autoencoder, nuclear pixels only | 0.555 (0.516–0.594) | 0.551 (0.515–0.586) | 0.500 |
| Nuclei count (baseline) | 0.521 (0.480–0.562) | 0.491 (0.453–0.527) | 0.686 |
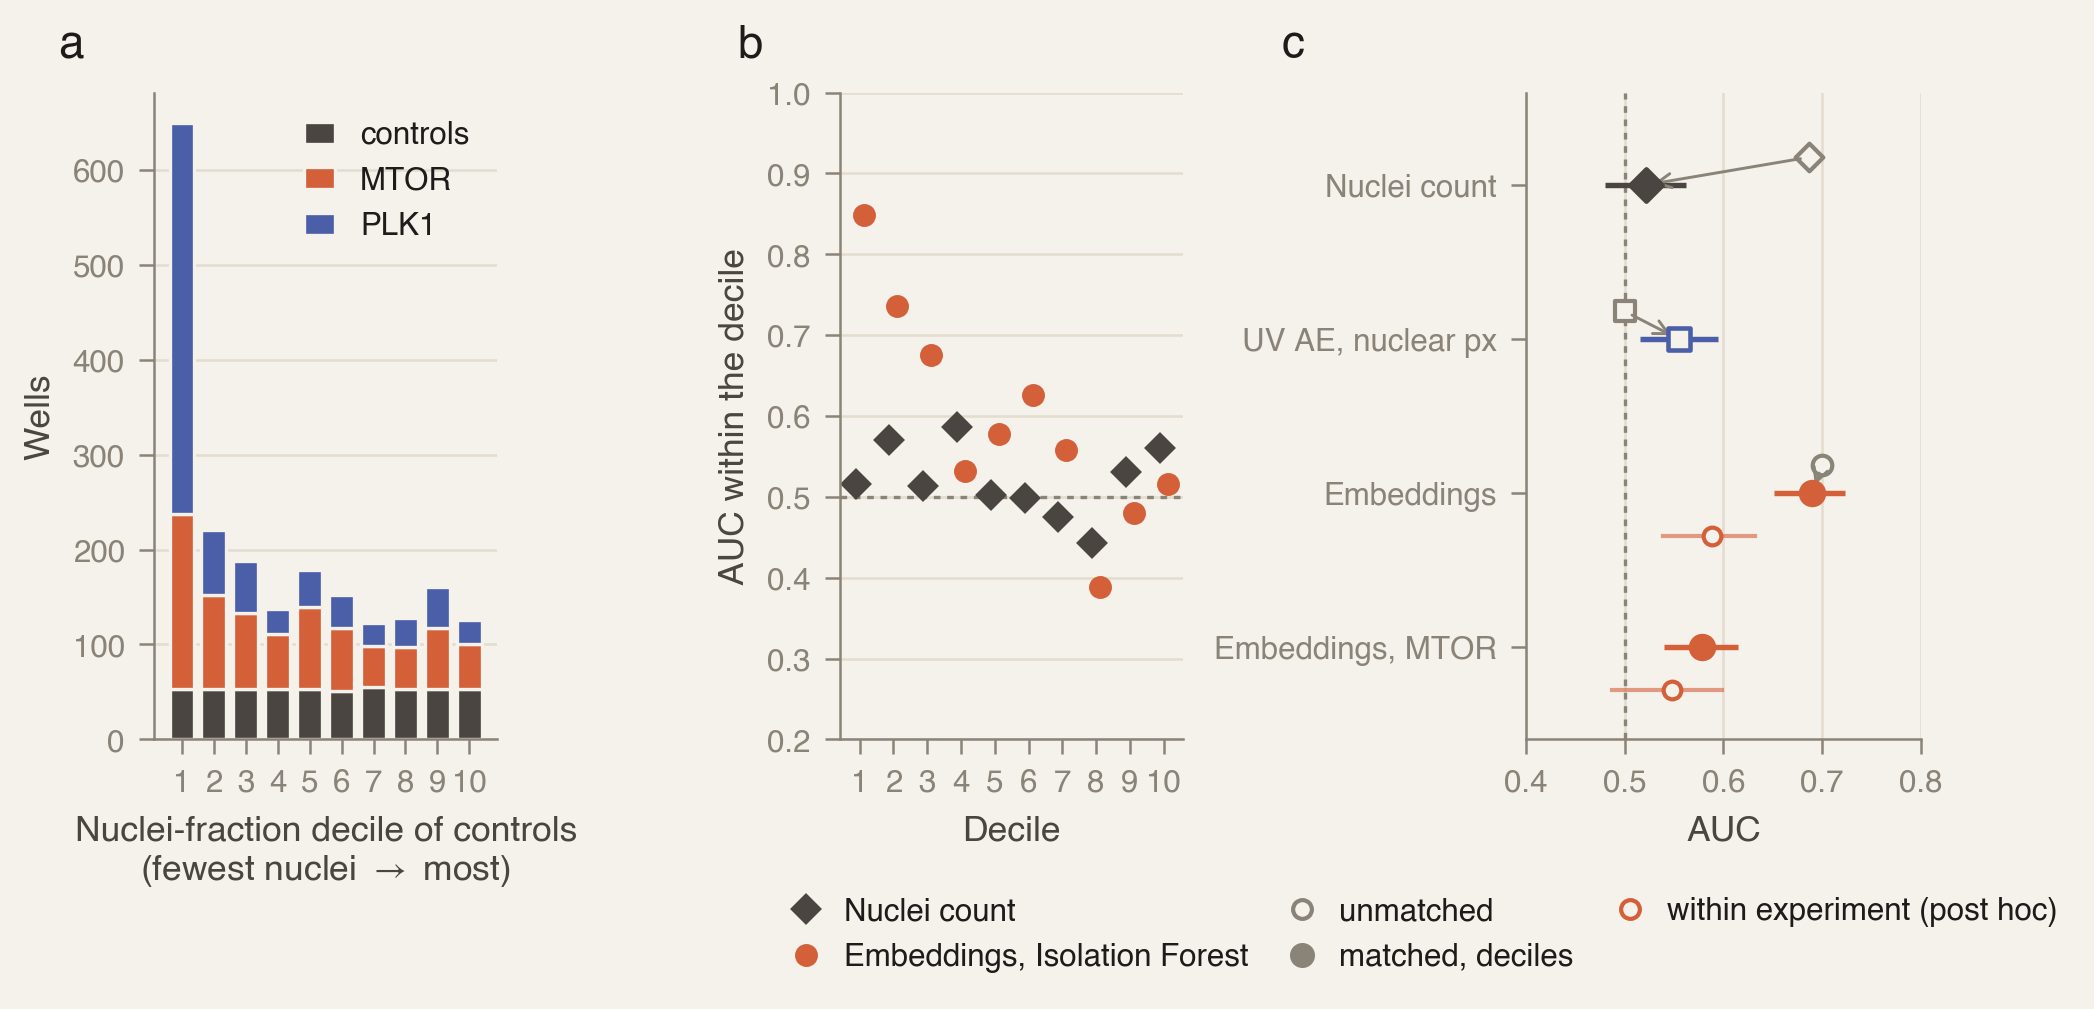
Figure 2b, drawn after scoring, adds a qualification. The embeddings' matched signal is concentrated among the wells with the fewest nuclei: 0.85, 0.74 and 0.68 in the three lowest deciles, between 0.39 and 0.63 in the other seven. What they see beyond a count is mostly in wells the knockouts have already thinned, not across the whole range.
Two expectations were wrong. The protocol predicted that most PLK1 wells would have fewer nuclei than any control and drop out of the comparison; only 30 of 791 did. PLK1 thins wells without emptying them. It also predicted the nuclear-pixel autoencoder would stay at chance; matched on count, it came out slightly above (0.555). A further check made after scoring, labeled as such: twenty bins instead of ten change nothing, but bins drawn within each experiment — a stricter match with only about 35 controls per experiment — shrink the effect to 0.588 overall, still above chance, while MTOR alone falls to 0.548, with an interval that includes 0.5. The overall finding survives every binning tried; the MTOR finding survives only the one fixed in advance, which is why the next run made the stricter match its primary test.
Under the strictest match, the signal remains, and only in depleted wells
The fourth protocol took the two checks made after the third run and fixed them in advance, on fifteen more experiments nobody had scored: 2,064 wells on 135 plates. Controls are binned by decile within each experiment, so a knockout is only ever compared with controls from its own experiment and its own cell-count range, as profiling benchmarks compare perturbations with same-plate controls18. Inside those bins the nuclei count scored 0.490, so the match held.
Table 4 | Fourth run. Matched AUC for the embedding branch on fifteen further experiments, with controls binned by decile within each experiment; 95% intervals from the plate bootstrap.
| Comparison, embeddings | Matched AUC (95% CI) |
|---|---|
| All knockouts, within experiment | 0.608 (0.559–0.649) |
| MTOR alone | 0.545 (0.490–0.596) |
| Wells with more nuclei than the median control | 0.508 (0.428–0.588) |
| Global deciles, as in the third run | 0.689 (0.656–0.719) |
Every expectation written into the protocol held (Table 4). Under the strictest match tried, the embeddings still see something beyond cell count, but only among wells a knockout has already thinned: above the median count they are at chance. The subtler MTOR phenotype is not detected, per well and from one imaging site; Recursion uses MTOR as a positive control, which suggests it becomes visible when many wells and guides are aggregated. That is a narrower claim than the third run suggested, and a firmer one.
Discussion
Across four pre-registered protocols on RxRx3-core, the dual-branch design failed its own test — reconstruction error scored depleted wells as more normal, and fusion with the reversed score fell to near chance — while the embedding branch tied a nuclei count on every global comparison and beat it only once the comparison was restricted to controls of the same cell count. What the embeddings see beyond a count is real, replicated under two matching schemes, and confined to wells the knockouts have already thinned; above the median cell count they are at chance, and the subtler MTOR phenotype is not detected per well from one imaging site.
Several limits bound the claim. One cell type, one imaging site per well, 54 of 176 CRISPR experiments across four test sets, and two anomaly genes. The autoencoder runs at 128 × 128, which may lose nuclear detail. The embeddings are OpenPhenom's alone; no image model was trained on the visible channels. None of this rescues the design: the autoencoder's failure comes from what reconstruction error rewards, not from sample size.
The open question is what the embeddings see in depleted wells. The next step is to name it, by comparing knockouts and controls within the lowest-count bins on interpretable features such as nuclear size, shape and intensity.
Methods
Data. Recursion's public RxRx3-core3: HUVEC cells imaged in six fluorescent channels, a variant of Cell Painting1,2, at one imaging site per well, from the 16 CRISPR experiments that sit entirely inside two dataset shards. Normal wells carry intron and exon control guides, which target no gene function. Anomalous wells are the PLK1 and MTOR knockouts that every experiment includes as positive controls: PLK1 stops cell division19; MTOR's phenotype, a change in cell size20, is subtler.
Detectors. A convolutional autoencoder on the Hoechst (nuclear) channel at 128 × 128, scored by reconstruction error; an Isolation Forest5 over the pre-computed OpenPhenom embeddings released with the dataset3, with a plain distance to the normal centroid as a comparator; and a fused score averaging the two branches' ranks. The fixed baseline is the fraction of Hoechst-bright pixels: a cell count, nothing more.
First protocol. Committed before any detector was trained15. It fixed the split by experiment (10 to fit, 6 held out), the settings, the direction of every score, the three comparisons that matter, and a written expectation of the result. Detectors were fitted on 359 normal wells and never saw a knockout. The held-out set — 848 wells on 54 plates — was scored once.
Uncertainty. Intervals come from a bootstrap that resamples whole plates14, because wells on a plate share a batch, and batch effects are a dominant signal in these data6,7,8.
Second protocol. Two repairs designed after the first result — scoring the autoencoder on nuclear pixels only, and regressing cell count out of each embedding dimension — scored once on eight experiments no earlier run had touched: 1,150 wells, 862 knockouts, 72 plates.
Third protocol. Control wells cut into ten bins by nuclei fraction; each knockout compared only with controls in its own bin, with the built-in check that the cell count itself score between 0.45 and 0.55. Scored once on fifteen further experiments: 2,108 wells on 135 plates; 1,533 of 1,578 knockouts had a control with a matching count.
Fourth protocol. The two checks made after the third run, fixed in advance: deciles drawn within each experiment, so a knockout is compared only with controls from its own experiment and cell-count range18, and the above-median comparison. Scored once on fifteen more experiments: 2,064 wells on 135 plates; the within-bin nuclei count scored 0.490.
Verification. All four protocols, the detectors, the plate bootstrap and the results are committed with 14 unit tests, and the whole evaluation reruns in about a minute on a laptop.
Data availability
We used the RxRx3-core dataset, available from Recursion Pharmaceuticals at rxrx.ai, under Recursion's licensing terms. The dataset was not modified. No images or trained models are committed with the project, because the dataset license treats trained models as derivative technology.
Code availability
The analysis repository is private. The four protocols — settings, score directions, comparisons and written expectations — are summarized here and recorded in full in the project's protocol documents, alongside the committed results and unit tests.
Pre-registration statement
Pre-registered means committed to the project's own repository before the corresponding detectors were trained or test wells loaded, not lodged with an external registry. Four protocols to date, each scored once on experiments no earlier run had touched; wrong written expectations stay in the protocols as written, and every analysis made after seeing a score is labeled as such above. The one deviation was an Apple-silicon training crash fixed before any score was produced; no setting changed.
Competing interests
None.
References
- Bray MA, Singh S, Han H, et al. Cell Painting, a high-content image-based assay for morphological profiling using multiplexed fluorescent dyes. Nature Protocols 11, 1757–1774 (2016). doi:10.1038/nprot.2016.105.
- Fay MM, Kraus O, Victors M, et al. RxRx3: Phenomics map of biology. bioRxiv (2023). doi:10.1101/2023.02.07.527350.
- Kraus O, Comitani F, Urbanik J, et al. RxRx3-core: Benchmarking drug-target interactions in high-content microscopy. arXiv 2503.20158 (2025). arXiv:2503.20158. Data: recursionpharma/rxrx3-core, Recursion license.
- Kraus O, Kenyon-Dean K, Saberian S, et al. Masked autoencoders for microscopy are scalable learners of cellular biology. Proceedings of IEEE/CVF CVPR, 11757–11768 (2024). doi:10.1109/CVPR52733.2024.01117.
- Liu FT, Ting KM, Zhou ZH. Isolation Forest. Proceedings of IEEE ICDM, 413–422 (2008). doi:10.1109/ICDM.2008.17.
- Caicedo JC, Cooper S, Heigwer F, et al. Data-analysis strategies for image-based cell profiling. Nature Methods 14, 849–863 (2017). doi:10.1038/nmeth.4397.
- Arevalo J, Su E, Ewald JD, et al. Evaluating batch correction methods for image-based cell profiling. Nature Communications 15, 6516 (2024). doi:10.1038/s41467-024-50613-5.
- Sypetkowski M, Rezanejad M, Saberian S, et al. RxRx1: A dataset for evaluating experimental batch correction methods. Proceedings of IEEE/CVF CVPR Workshops, 4285–4294 (2023). doi:10.1109/CVPRW59228.2023.00451.
- Seal S, Dee W, Shah A, et al. Counting cells can accurately predict small-molecule bioactivity benchmarks. Nature Communications 17, 2436 (2026). doi:10.1038/s41467-026-68725-5.
- Snijder B, Sacher R, Rämö P, et al. Population context determines cell-to-cell variability in endocytosis and virus infection. Nature 461, 520–523 (2009). doi:10.1038/nature08282.
- Shpigler A, Kolet N, Golan S, et al. Anomaly detection for high-content image-based phenotypic cell profiling. Cell Systems 16, 101429 (2025). doi:10.1016/j.cels.2025.101429.
- Nalisnick E, Matsukawa A, Teh YW, et al. Do deep generative models know what they don't know? ICLR (2019). arXiv:1810.09136.
- Geirhos R, Jacobsen JH, Michaelis C, et al. Shortcut learning in deep neural networks. Nature Machine Intelligence 2, 665–673 (2020). doi:10.1038/s42256-020-00257-z.
- Field CA, Welsh AH. Bootstrapping clustered data. Journal of the Royal Statistical Society Series B 69, 369–390 (2007). doi:10.1111/j.1467-9868.2007.00593.x.
- Nosek BA, Ebersole CR, DeHaven AC, et al. The preregistration revolution. Proceedings of the National Academy of Sciences 115, 2600–2606 (2018). doi:10.1073/pnas.1708274114.
- Chandrasekaran SN, Alix E, Arevalo J, et al. Morphological map of under- and overexpression of genes in human cells. Nature Methods 22, 1742–1752 (2025). doi:10.1038/s41592-025-02753-9.
- Rohban MH, Singh S, Wu X, et al. Systematic morphological profiling of human gene and allele function via Cell Painting. eLife 6, e24060 (2017). doi:10.7554/eLife.24060.
- Kalinin AA, Arevalo J, Serrano E, et al. A versatile information retrieval framework for evaluating profile strength and similarity. Nature Communications 16, 5181 (2025). doi:10.1038/s41467-025-60306-2.
- Sumara I, Giménez-Abián JF, Gerlich D, et al. Roles of polo-like kinase 1 in the assembly of functional mitotic spindles. Current Biology 14, 1712–1722 (2004). doi:10.1016/j.cub.2004.09.049.
- Fingar DC, Salama S, Tsou C, et al. Mammalian cell size is controlled by mTOR and its downstream targets S6K1 and 4EBP1/eIF4E. Genes & Development 16, 1472–1487 (2002). doi:10.1101/gad.995802.