Transposable-element insertions record a distinct population history in tomato
Transposable-element insertions were first tested against tomato traits genome-wide by Domínguez and colleagues1, and structural variants against SNPs for heritability by Zhou and colleagues2; neither separates TE-derived from other structural variants. The closest comparison of the two classes is in rapeseed, where TE insertions lowered gene expression and non-TE variants did not9. In human genetics, mobile-element insertions were less enriched among expression-altering variants than other structural variants10 — a reminder that TE origin need not mean larger effects. We asked the question in tomato with published data only: graph-pangenome SV genotypes for 706 accessions2, independent short-read1 and long-read3 call sets for checking them, and accession records from the original resequencing study4. Nothing was re-called from reads, and every test was pre-registered and scored once (Box 1, Methods).
Heritability partition between variant classes is unidentifiable in this panel
The first pre-registered question — do TE-derived variants carry more of tomato's heritability for fruit metabolites, flavor and expression than matched non-TE variants? — included a power check that had to pass before any trait was examined. It failed in every trait class, for a structural reason. Partitioning heritability between two sets of variants5 works when the relationship matrices built from them differ; in ~300 inbred accessions spanning wild, cherry and big-fruited tomato, matched TE-derived and non-TE variants gave matrices correlating at 0.97, because both mostly encode population structure (the top three components carry 43% of each). The precision of such estimates depends on how much relatedness varies between pairs6, and structure makes them unreliable7; with the two components this collinear, their difference cannot be resolved. A per-variant redesign failed its own power check as well: a single causal variant's association signal spread to a median of 29 other variants on six chromosomes, so no signal could be pinned to one class. Both designs were stopped before any trait was looked at. The structure that blocks trait attribution is itself a record of population history, and the remaining questions address that record directly, in all 706 accessions and with no traits.
TE-derived and non-TE variants are genotyped equally well
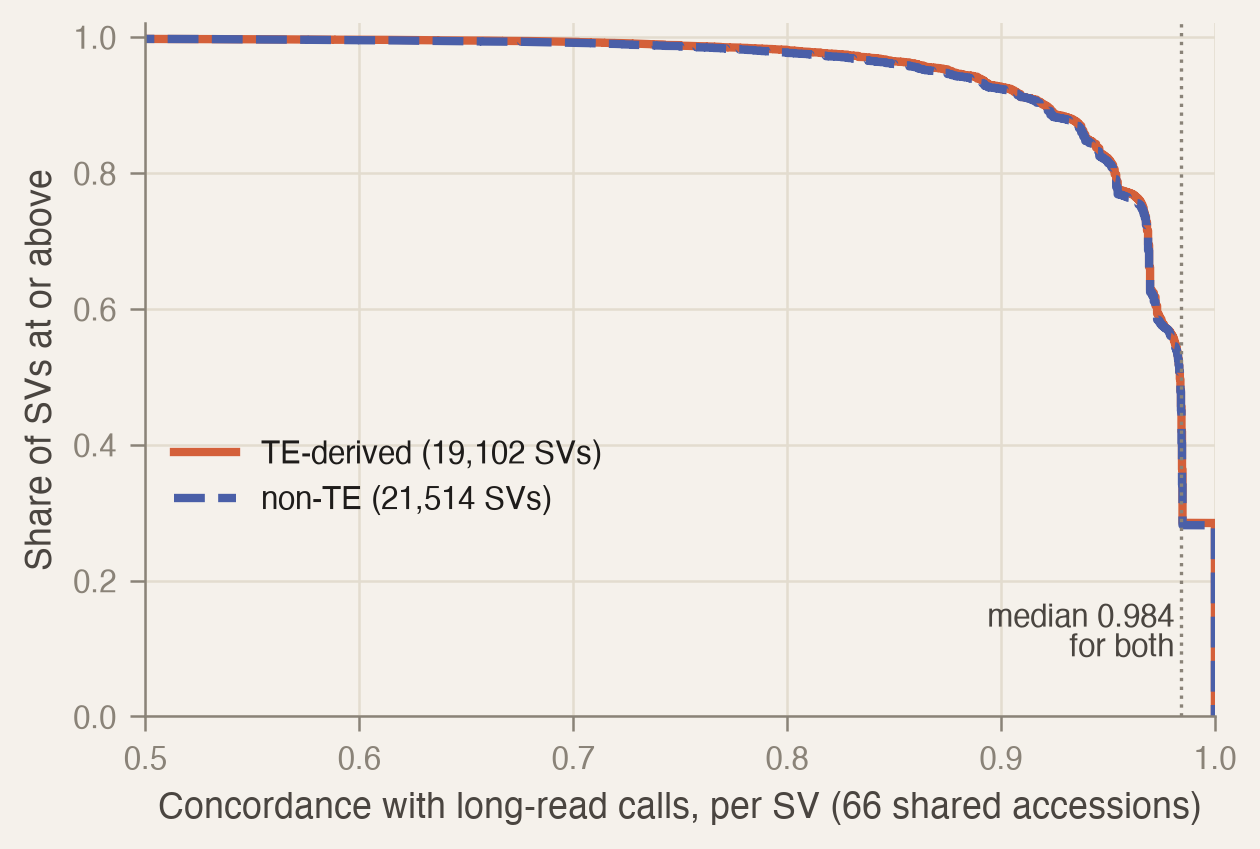
Genotyping transposable-element insertions from short reads is harder than genotyping other variants, because reads from repeats map ambiguously; if TE-derived variants were genotyped worse, every comparison below would partly measure error. Graph genotypes agree with independent long-read calls3 equally well for both classes on the 66 accessions both cover: median concordance 0.984 for TE-derived variants (19,102 variants) and 0.984 for non-TE variants (21,514) (Fig. 1). The result holds for high-confidence calls only and across matching windows from 50 to 500 bp, and short-read TE insertion calls1 agree too (median 0.987 over 838 variants on 531 shared accessions). Most variants are rare among the shared accessions, so agreement on absence carries much of the median; what matters for what follows is that the two classes do not differ.
TE-derived variants record a different population history
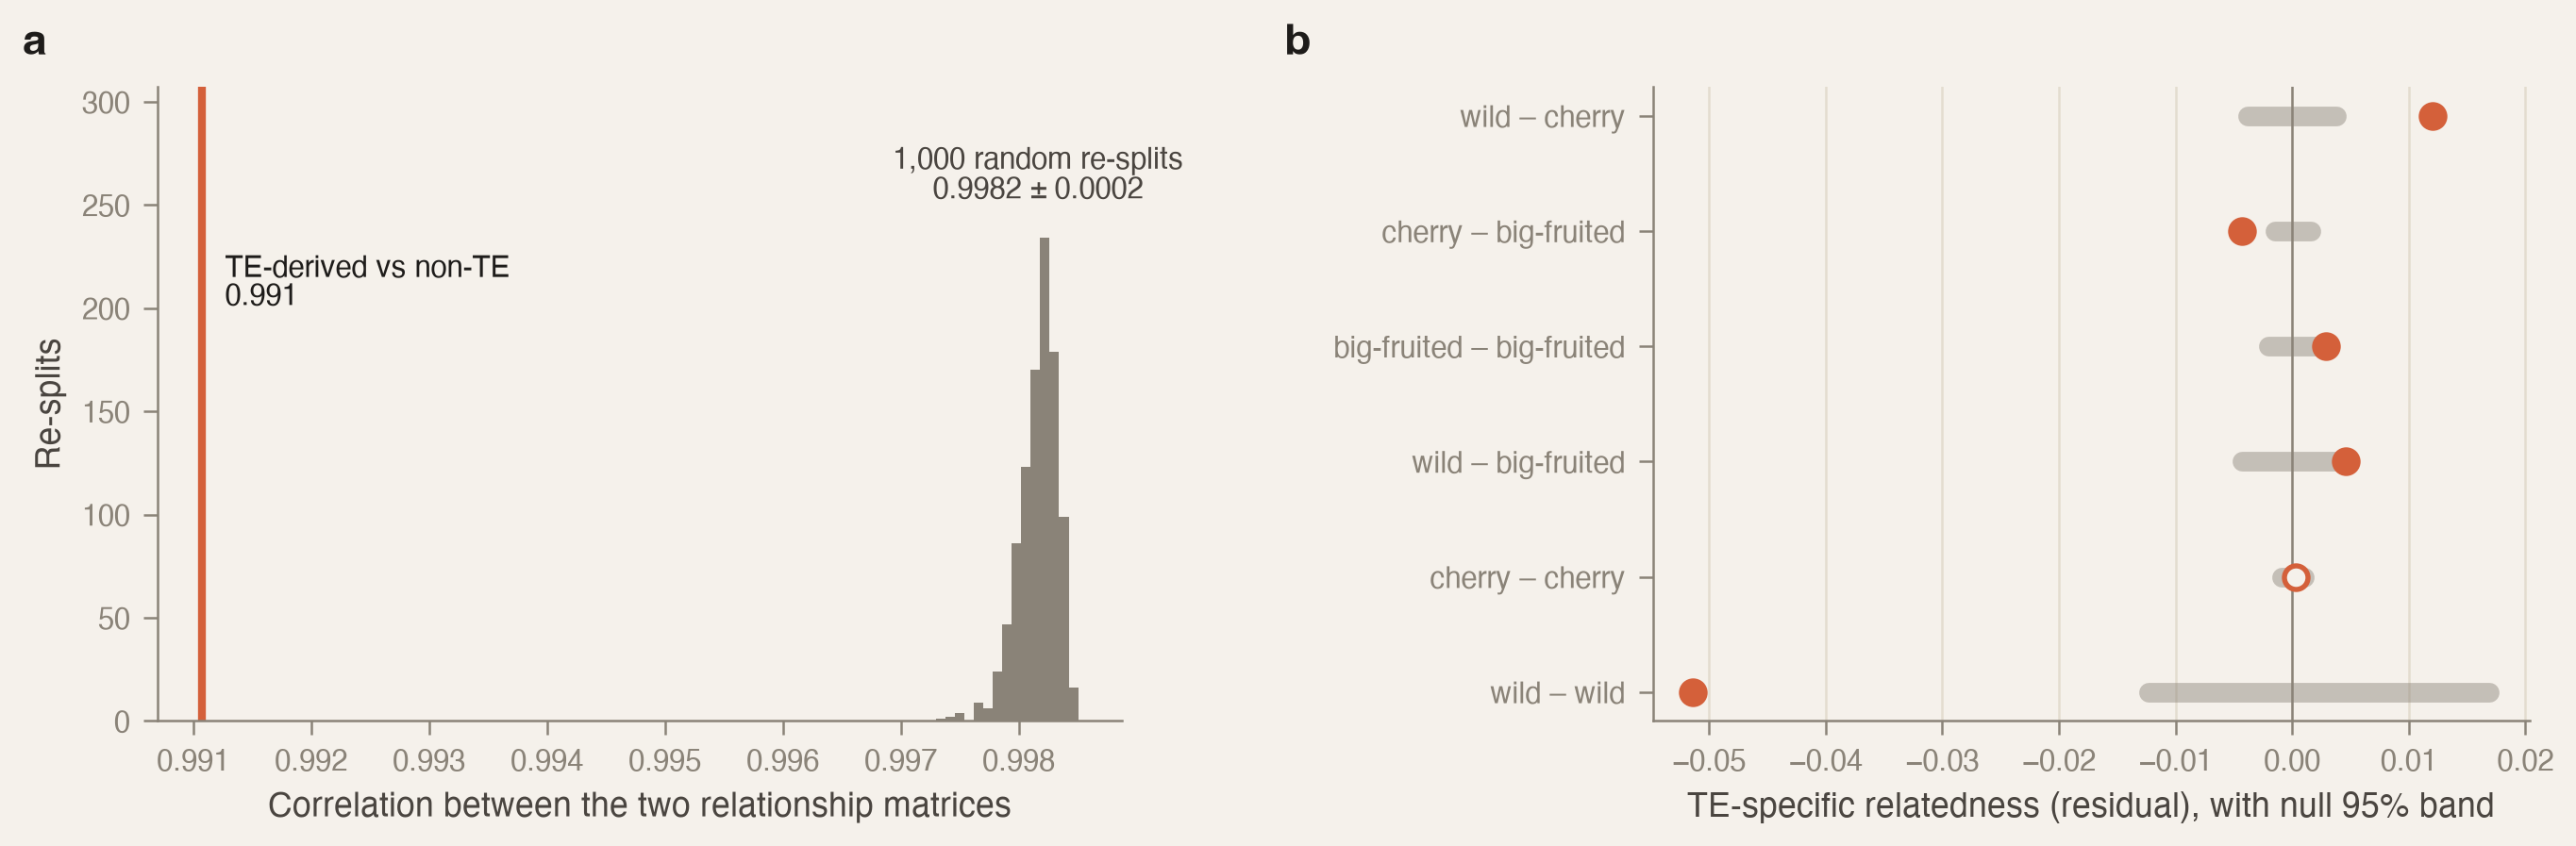
Relationship matrices built from 3,695 matched variants in each class correlate at 0.991 across the 547 accessions left after removing near-duplicates; random re-splits of the same variants give 0.998 ± 0.0002 (Fig. 2a), so the difference lies far outside chance, and it holds with 10 Mb region matching as well as 20 Mb. The difference concentrates in two places: TE insertions relate wild and cherry accessions more closely than other variants do, and cherry and big-fruited accessions less closely (Fig. 2b) — a pattern consistent with insertions inherited along particular lineages.
The obvious non-biological explanation is discovery bias: if TE-derived variants had been found in a different set of assembled genomes from other variants, their relatedness would differ for that reason alone. The public files do not record where each variant was found, so we checked indirectly, by a rule fixed before it ran (Methods). Among common variants, 97% of TE-derived and 95% of non-TE variants are carried by an accession assembled from high-fidelity long reads, and 84% and 82% match an independent long-read call, so the two classes could have been discovered almost equally; restricted to variants both routes could see, the difference reproduces (0.992 against a null of 0.998). A test within a single discovery route was not possible, because almost no common variants were found by only one; by the rule as written the verdict is therefore “partly explained”, and in substance discovery bias is an unlikely explanation.
Neither frequency spectra nor insertion ages separate the classes
Across wild, cherry and big-fruited groups, the share of rare variants is almost identical for the two classes (differences under half a percentage point). Two measures differed before correction for multiple testing — TE variants are slightly more differentiated between wild and cherry tomato8, and slightly less often lost between wild and cultivated — and neither survives correction. Taking divergence from the family's reference copy as a clock, young TE insertions (at most 2% diverged) are private to one group 2.2 percentage points more often than old ones, and specificity falls with age; but rare alleles are private more often whatever their age, and young insertions are rarer. Comparing alleles carried by similar numbers of accessions, the difference shrinks to 0.8 points and its interval includes zero. The pre-registered test passed; the lineage-marker reading of insertion age is weak.
The signal follows the element, not the pericentromere
An exploratory breakdown put most of the history difference on Gypsy LTR retrotransposons of intermediate age, with DNA transposons near their nulls. That raises an objection: Gypsy elements crowd into the gene-poor pericentromeres, where recombination is rare and long blocks of DNA — including segments bred in from wild relatives — travel intact, so anything sitting there might record a distinct history whatever it is made of. A third pre-registration separated the two readings by comparing Gypsy with matched non-TE variants inside each kind of region, with the rule fixed in advance: a difference in the chromosome arms, where recombination is normal, would mean the element carries the signal.
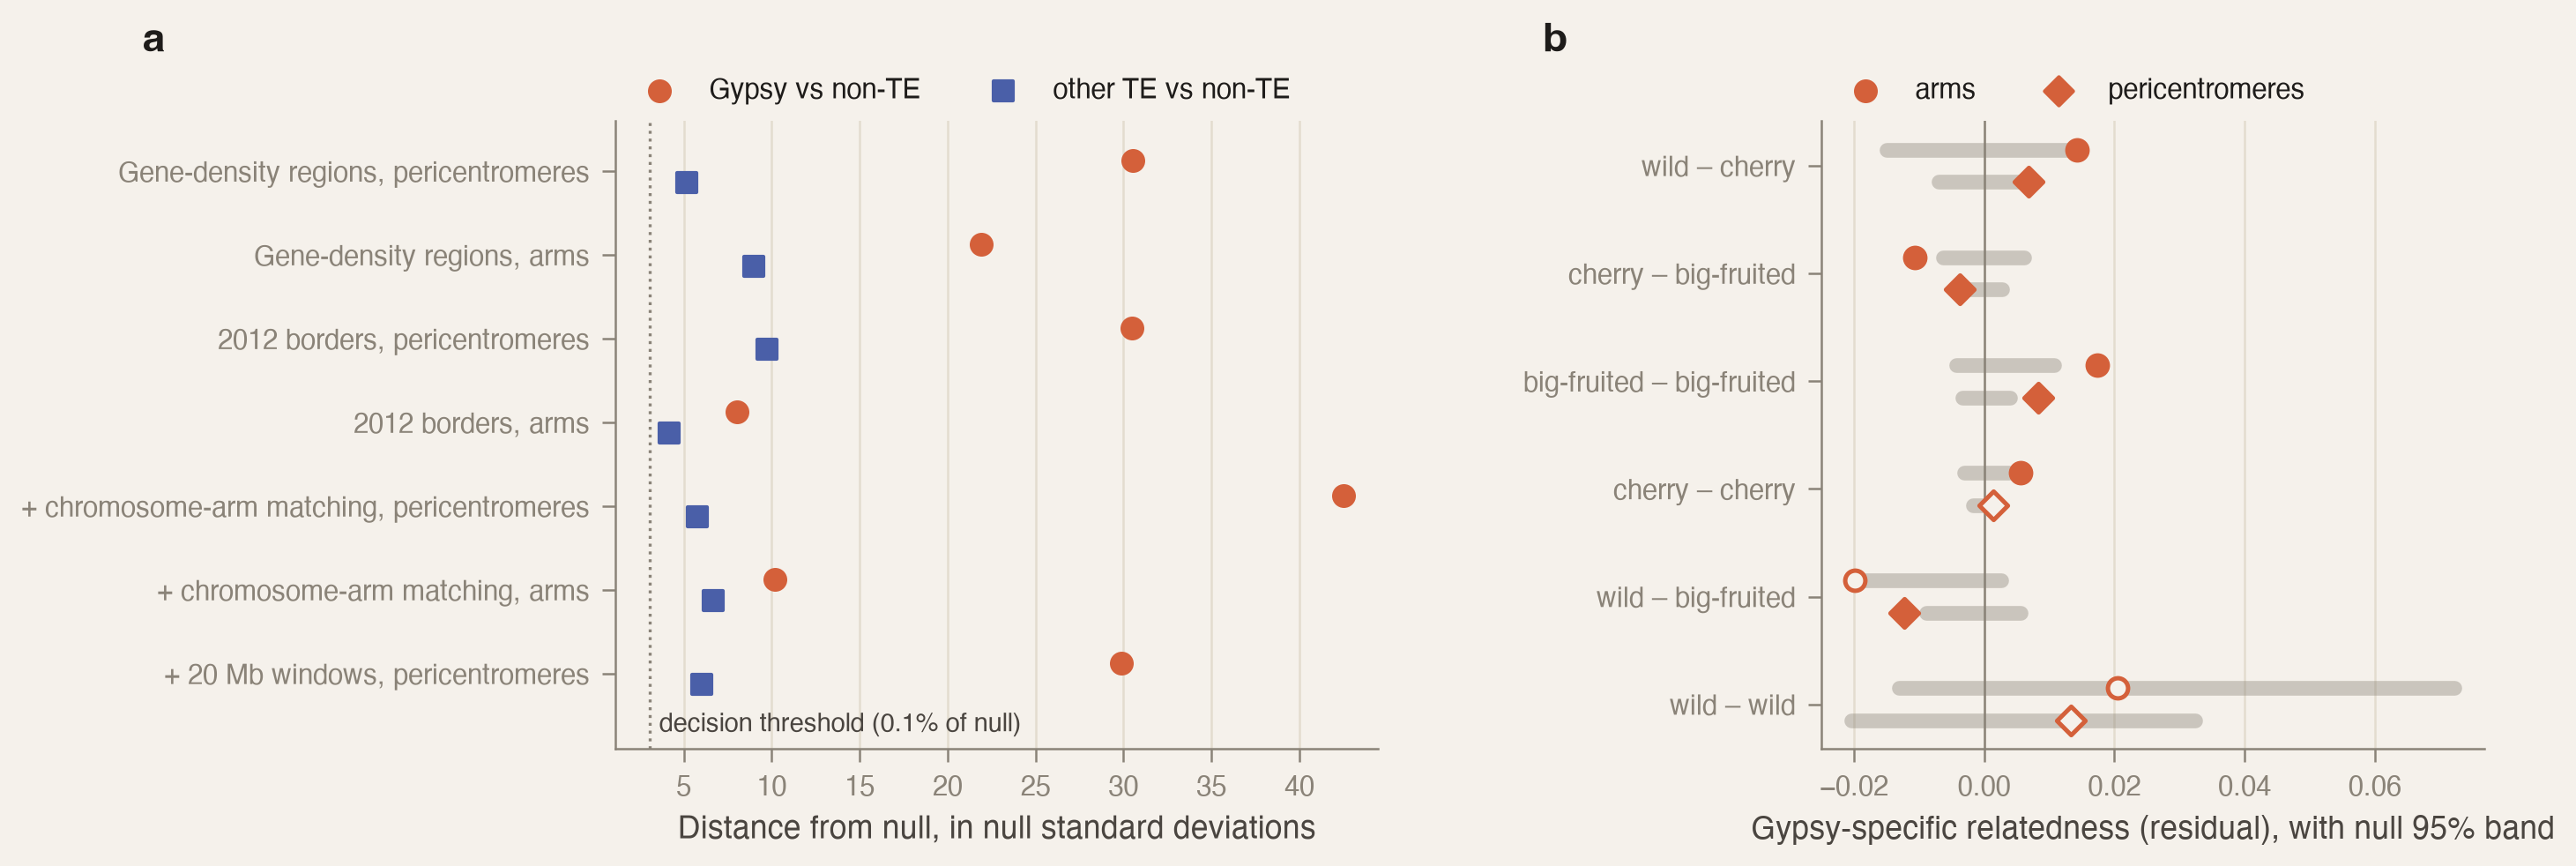
It does. In the arms, relationship matrices from 430 matched Gypsy and non-TE variants correlate at 0.926 against a null of 0.972; in the pericentromeres, 0.975 against 0.996 (Fig. 3a). The same group pattern appears in both: Gypsy relates wild and cherry accessions more closely, and cherry and big-fruited accessions less closely, than other variants do (Fig. 3b). Other transposable-element variants differ from non-TE ones by about a tenth as much. The verdict holds with the independently published 2012 heterochromatin borders11 and with stricter matching.
Discussion
Across 547 tomato accessions, structural variants made of transposable elements record a population history that matched variants of any other origin do not, and the signal belongs to the elements — above all Gypsy retrotransposons of intermediate age — rather than to the pericentromeric neighborhoods they occupy. The two classes are genotyped equally well, their frequency spectra through domestication are indistinguishable, and the discovery-bias check argues against an artifactual origin, so the difference is most plausibly a real feature of how these insertions descended through wild, cherry and big-fruited tomato.
Several limits bound the claim. Variant discovery was not uniform: the graph was built from 32 high-fidelity assemblies, 100 long-read genomes and short reads, so rare variants in over-represented groups are likelier to have been found, and the discovery check could use only the 24 assembled accessions genotyped in this panel. The TE library derives from one reference genome, so families absent from it can be missed. Insertion ages rest on divergence to one reference copy per family, not on paired long terminal repeats. Inbred lines were treated as haploid, with heterozygous calls set to missing. And the same collinearity that revealed the history signal made the original trait question unanswerable in this panel: whether TE-derived variants carry distinct heritability remains open, and would need a design or population where the two relationship matrices separate.
Why Gypsy in particular records a different history is not settled. One candidate mechanism is that segments introgressed from wild relatives during resistance breeding4 carry Gypsy insertions that arose in the donor lineage, marking wild origin more sharply than the older variants alongside them. A pre-registered test of this stopped at its gate. Wild segments were called from SNPs alone, as stretches carrying alleles typical of S. pimpinellifolium, and had to recover Lin and colleagues' five introgressed resistance and quality loci4 before the Gypsy comparison could run. They recovered none of 31 known carrier–locus pairs, so the comparison was never made. A diagnostic run after the verdict shows why: the carriers do differ from other accessions at every locus, but all five loci were bred in from more distant wild species (S. peruvianum, S. chilense, S. habrochaites), whose alleles a pimpinellifolium-based caller cannot recognize. The pre-registration had anticipated this for three of the five loci and missed it for two. The question stays open; answering it needs a donor-agnostic caller, with positive controls checked against what that caller can see before sign-off.
Methods
Data sources. SV genotypes for 706 accessions from the tomato graph pangenome2; independent short-read TE insertion calls1 and long-read SV calls3 for concordance checks; accession passports and group labels from the resequencing study4 and BioSample records. Nothing was re-called from sequencing reads, and all computation ran on one laptop.
Variant labeling. Each variant's sequence was annotated against a library built from the SL5.0 reference's repeat annotation (one exemplar per family: the longest copy within 10% divergence; 4,588 families). TE-derived means at least 80% of the variant covered by one known family; non-TE means at most 20% covered by any repeat; the remainder is ambiguous and excluded from class comparisons. Where labels could be checked against an independent annotation3, 7.8% of non-TE labels disagreed, under the 10% threshold pre-set for rebuilding the library.
Accessions and groups. Near-duplicates were removed by identity-by-state ≥ 0.99 (706 → 547; the standard heterozygosity-based kinship estimator is undefined for inbred lines). Accessions were grouped as wild (PIM), cherry (CER) and big-fruited (BIG) from the published labels, with unlabeled accessions assigned by 10-nearest-neighbor vote requiring 8 agreeing neighbors. Inbred lines were treated as haploid; heterozygous calls were set to missing.
Matching and null construction. TE-derived and non-TE variants were matched within strata of minor-allele frequency, length, variant type and 20 Mb genomic region (10 Mb as sensitivity). The null re-splits the pooled matched variants into random halves within the same strata 1,000 times and recomputes the statistic; “different” requires the observed value below the null's 0.001 quantile.
Genotype concordance. Long-read calls3 were lifted to SL5.0 by re-mapping ±500 bp flanks with minimap2 (MAPQ ≥ 30, ≥ 90% coverage, ≥ 95% identity) and matched to graph variants within 100 bp (50–500 bp as sensitivity); per-variant concordance is the share of the 66 shared accessions with equal calls. Short-read insertion calls1 were matched by interval containment, reflecting their split-read coordinates.
Heritability-partition power check. Class-specific relationship matrices were compared by the correlation of their off-diagonal entries against the random-half baseline; Haseman–Elston regression with chromosome-half block resampling supplied the error model. The per-variant redesign was assessed by the spread of single-variant association signal across matched variants.
Frequency spectra and ages. Site-frequency spectra were compared by hypergeometric projection within groups; between-group differentiation used Hudson's FST as a ratio of averages8; multiple tests were Holm-corrected. Insertion age is the variant sequence's divergence from its family's reference exemplar (young ≤ 2%), and the age analysis compares group-privacy of young against old insertions, with a frequency-matched version pre-registered alongside.
Pericentromeres. Defined per chromosome from gene density (midpoint rule on the bimodal 20th–80th percentile span; 58–71% of each chromosome), with the 2012 genome consortium's heterochromatin borders11 lifted from SL2.40 as an independent check (nine chromosomes lifted cleanly). The element-versus-region comparison ran Gypsy against matched non-TE variants separately within pericentromeres and arms, with the decision rule fixed before scoring.
Protocol. Every stage was pre-registered in the project repository: the question, eligibility, statistics, decision rule and seeds were committed, and the analysis grid frozen with its SHA-256 hash recorded, before any result was computed; each question was scored once and deviations are logged in the stage documents.
Extended Data — the transposable-element landscape
The scored tests above compare classes of variants; the figures below describe them — what the classes are made of and where they sit. None of this is a pre-registered test.
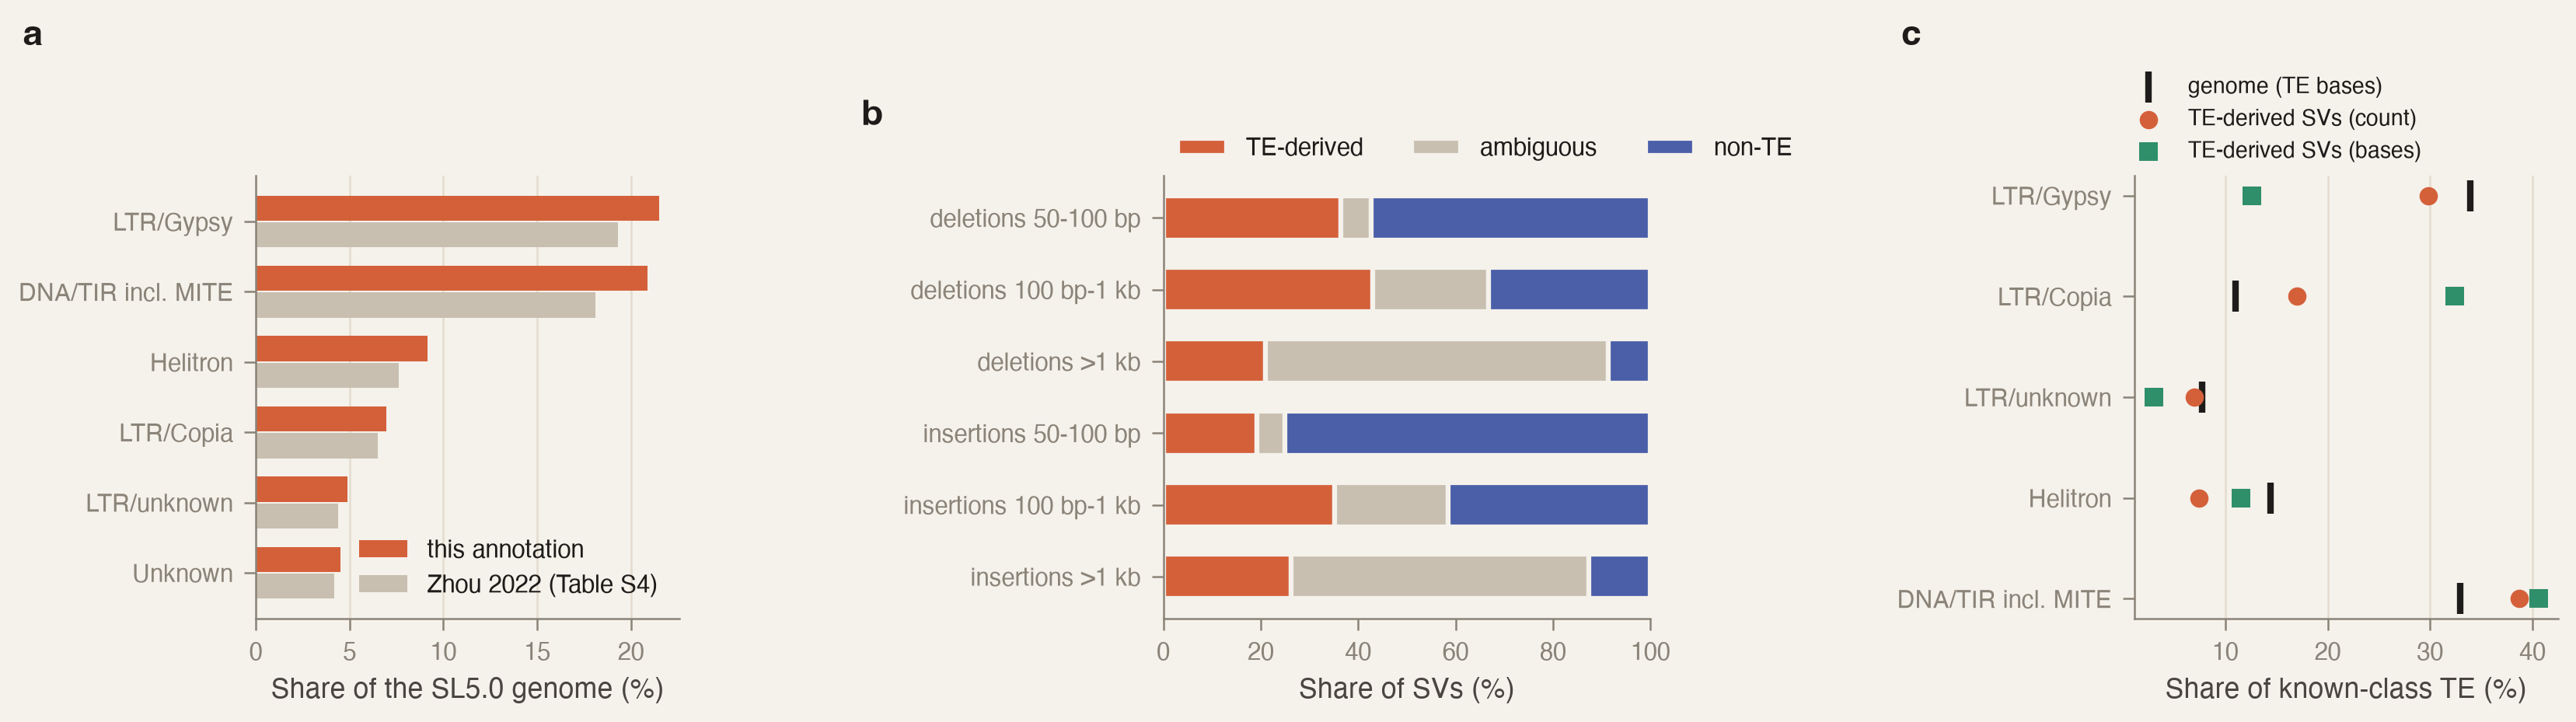
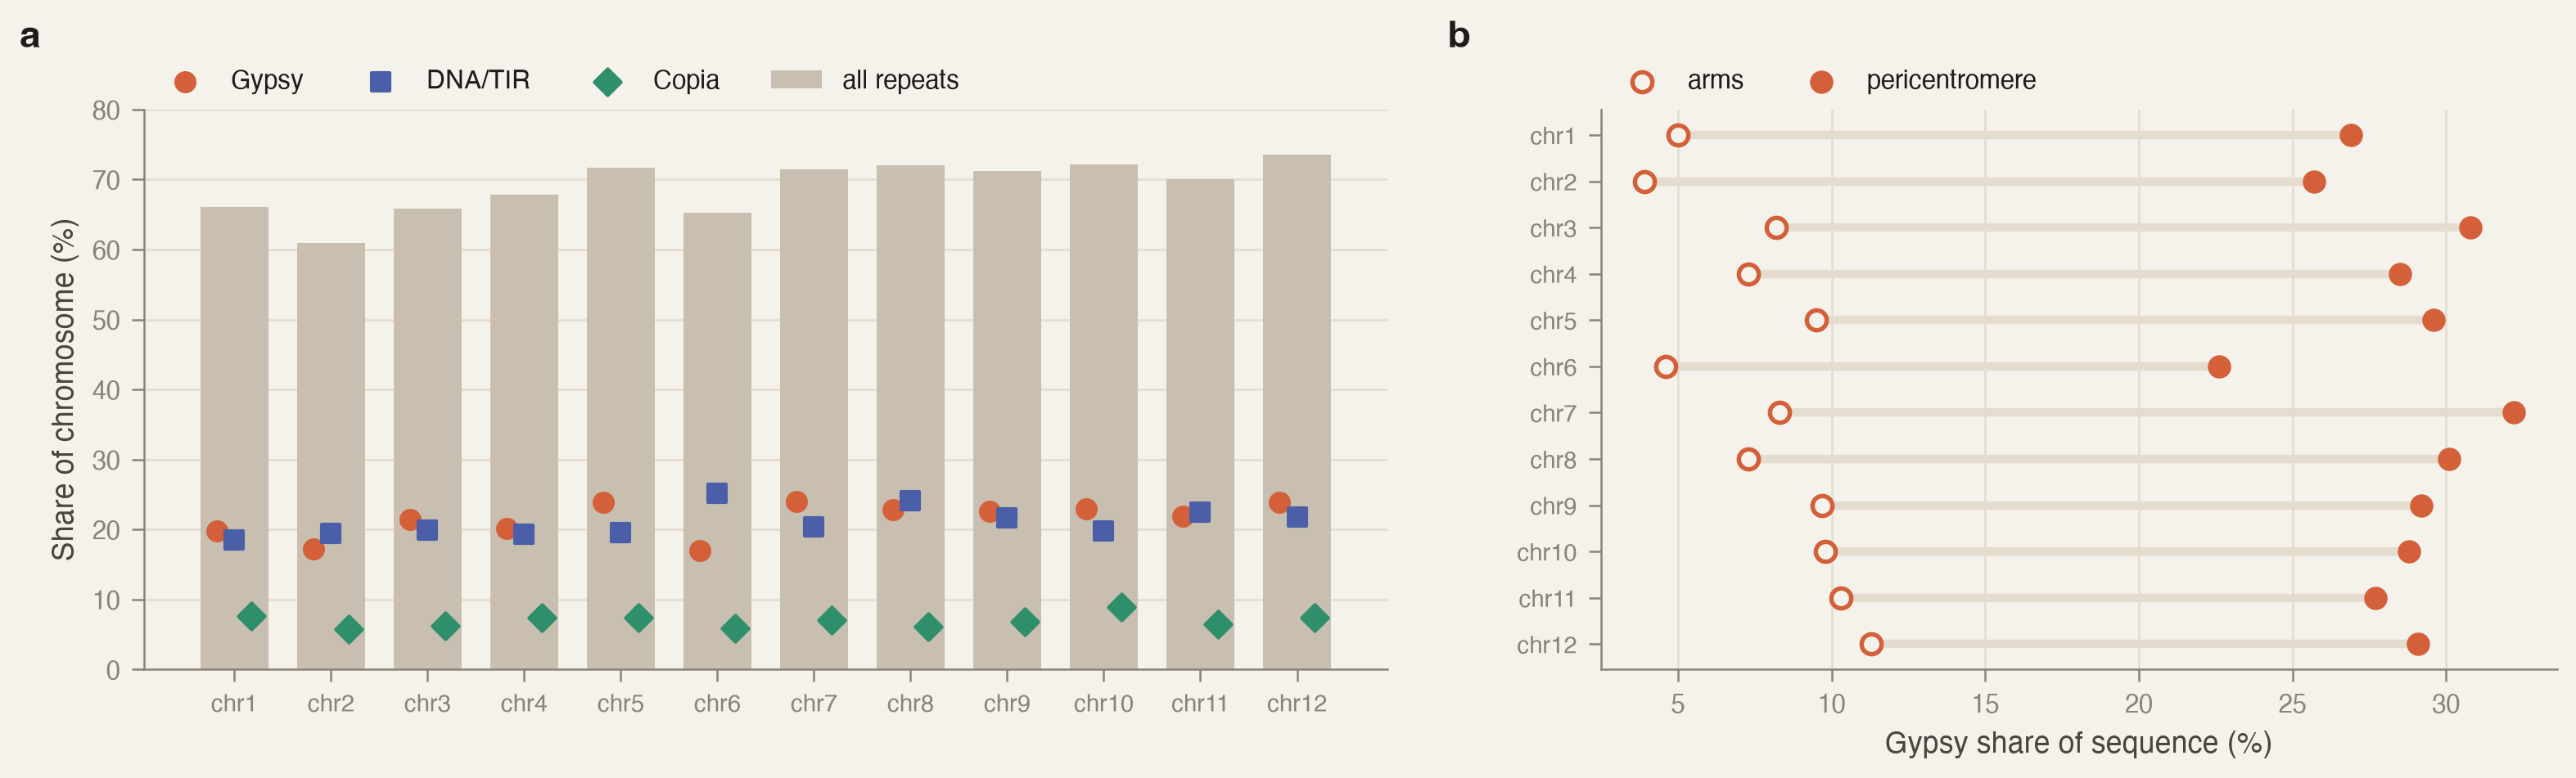
How much is transposable element. By the reference's own repeat annotation, 69% of the tomato genome is repeats, led by Gypsy (22%) and DNA transposons (21%); a published summary of the same reference gives 61% with the same ranking2, the gap mostly fragmentary hits that summary drops (Extended Data Fig. 1). Among structural variants over 100 bp, 77% of deletions and 72% of insertions contain repeat sequence, close to the 84% and 76% reported from long-read genomes3. Variants over 1 kb are around 90% repeat, mostly several element families nested together.
Which families are moving. Copia makes up 11% of the genome's transposable-element sequence but 32% of the sequence in variable insertions; many are 4.5–5 kb, the size of a complete element, which fits the recent activity of the Copia-family Rider element in tomato12. Short-read insertion calls agree: Copia is 36% of polymorphic insertions there, Rider the commonest single family, though Gypsy still leads by count1. Gypsy is the reverse — a third of the genome's element sequence, but its variable copies are mostly short fragments (Extended Data Fig. 1c).
Where they sit. The gene-poor pericentromeres cover about two thirds of the genome and hold 30% of genes, but 79% of Gypsy variants, against 43% of non-TE variants (Extended Data Fig. 2). Gypsy variants also avoid genes within the gene-rich arms: 10% fall inside genes, against 30% of non-TE variants. Both patterns match earlier work: tomato's pericentromeric heterochromatin is heavily populated by Gypsy-like elements14, and in short-read insertion calls about 6% of Gypsy insertions fall in genes against about 20% of Copia ones1. The avoidance is specific to Gypsy, not to transposable elements in general, and in tomato has been attributed to insertion preference rather than selection against the copies1.
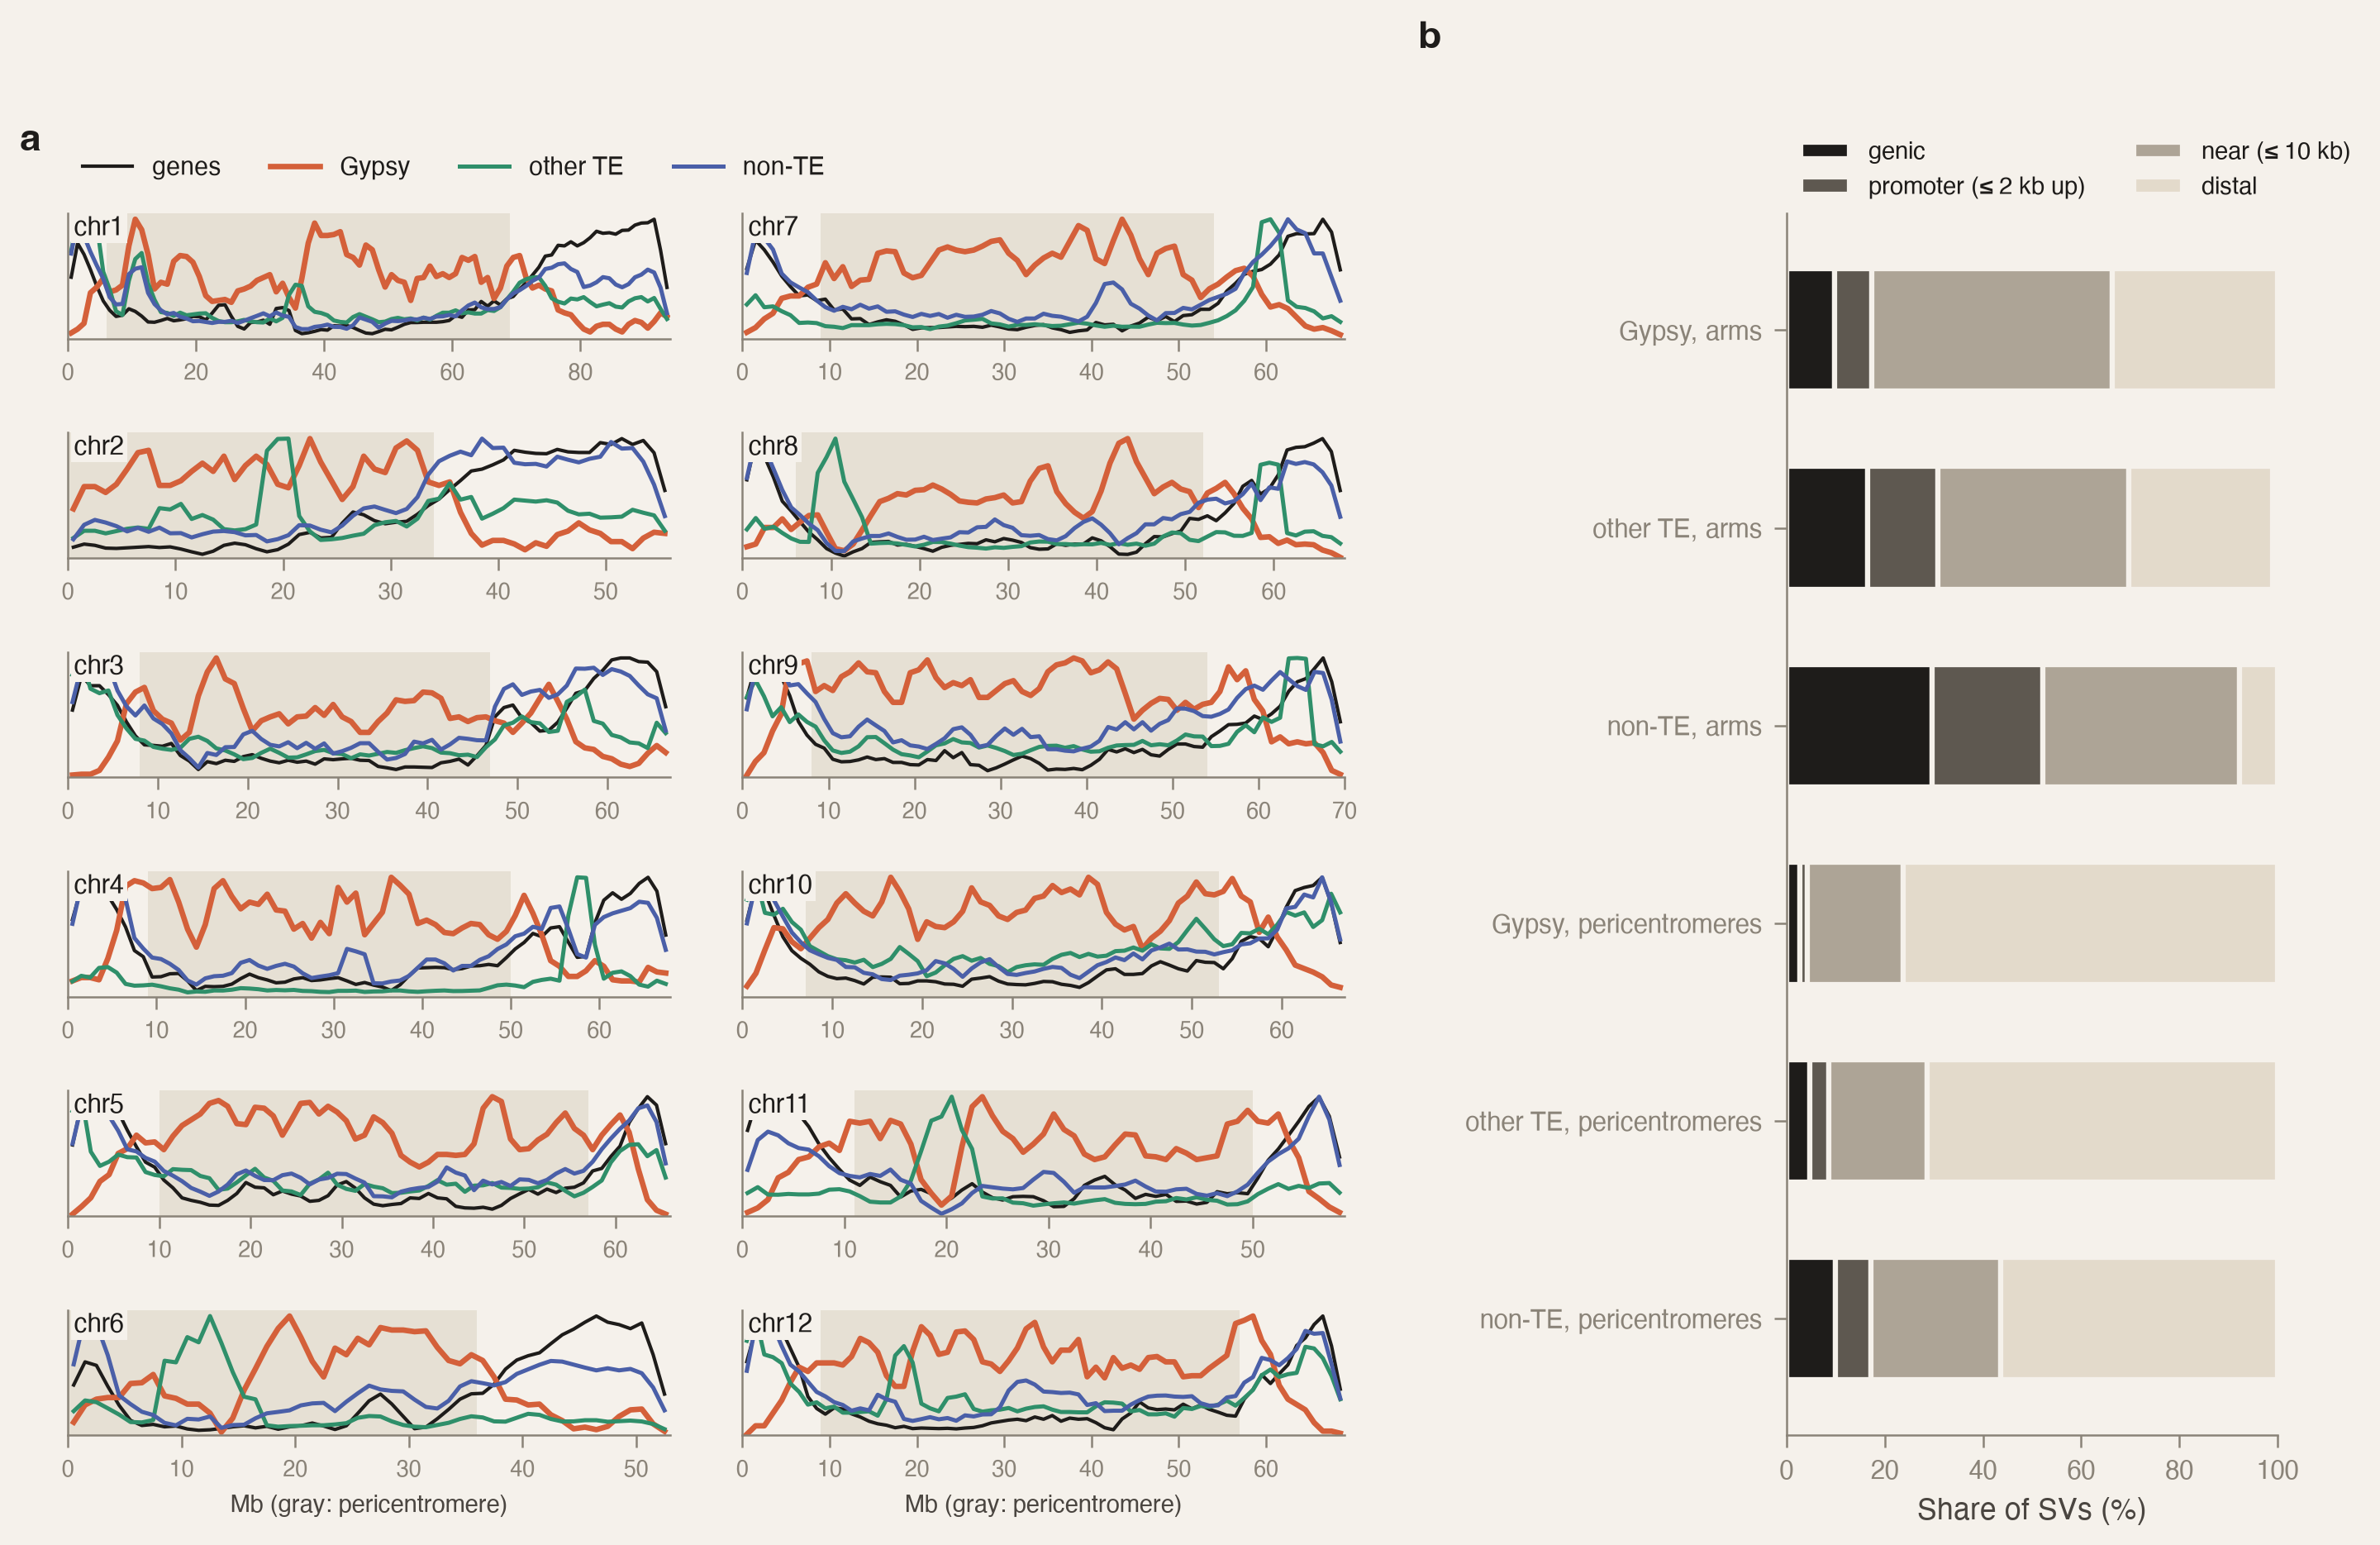
Chromosome by chromosome. The same picture holds on every chromosome: repeats are 61–74% of each, and Gypsy is three to seven times denser in each pericentromere than in its arms (Extended Data Fig. 3). Chromosome 6 stands apart, with the least Gypsy and the most DNA transposon sequence; chromosome 2 has the fewest repeats, partly because its ribosomal-DNA arm is poorly assembled. Tomato is diploid, so there are no subgenomes to compare.
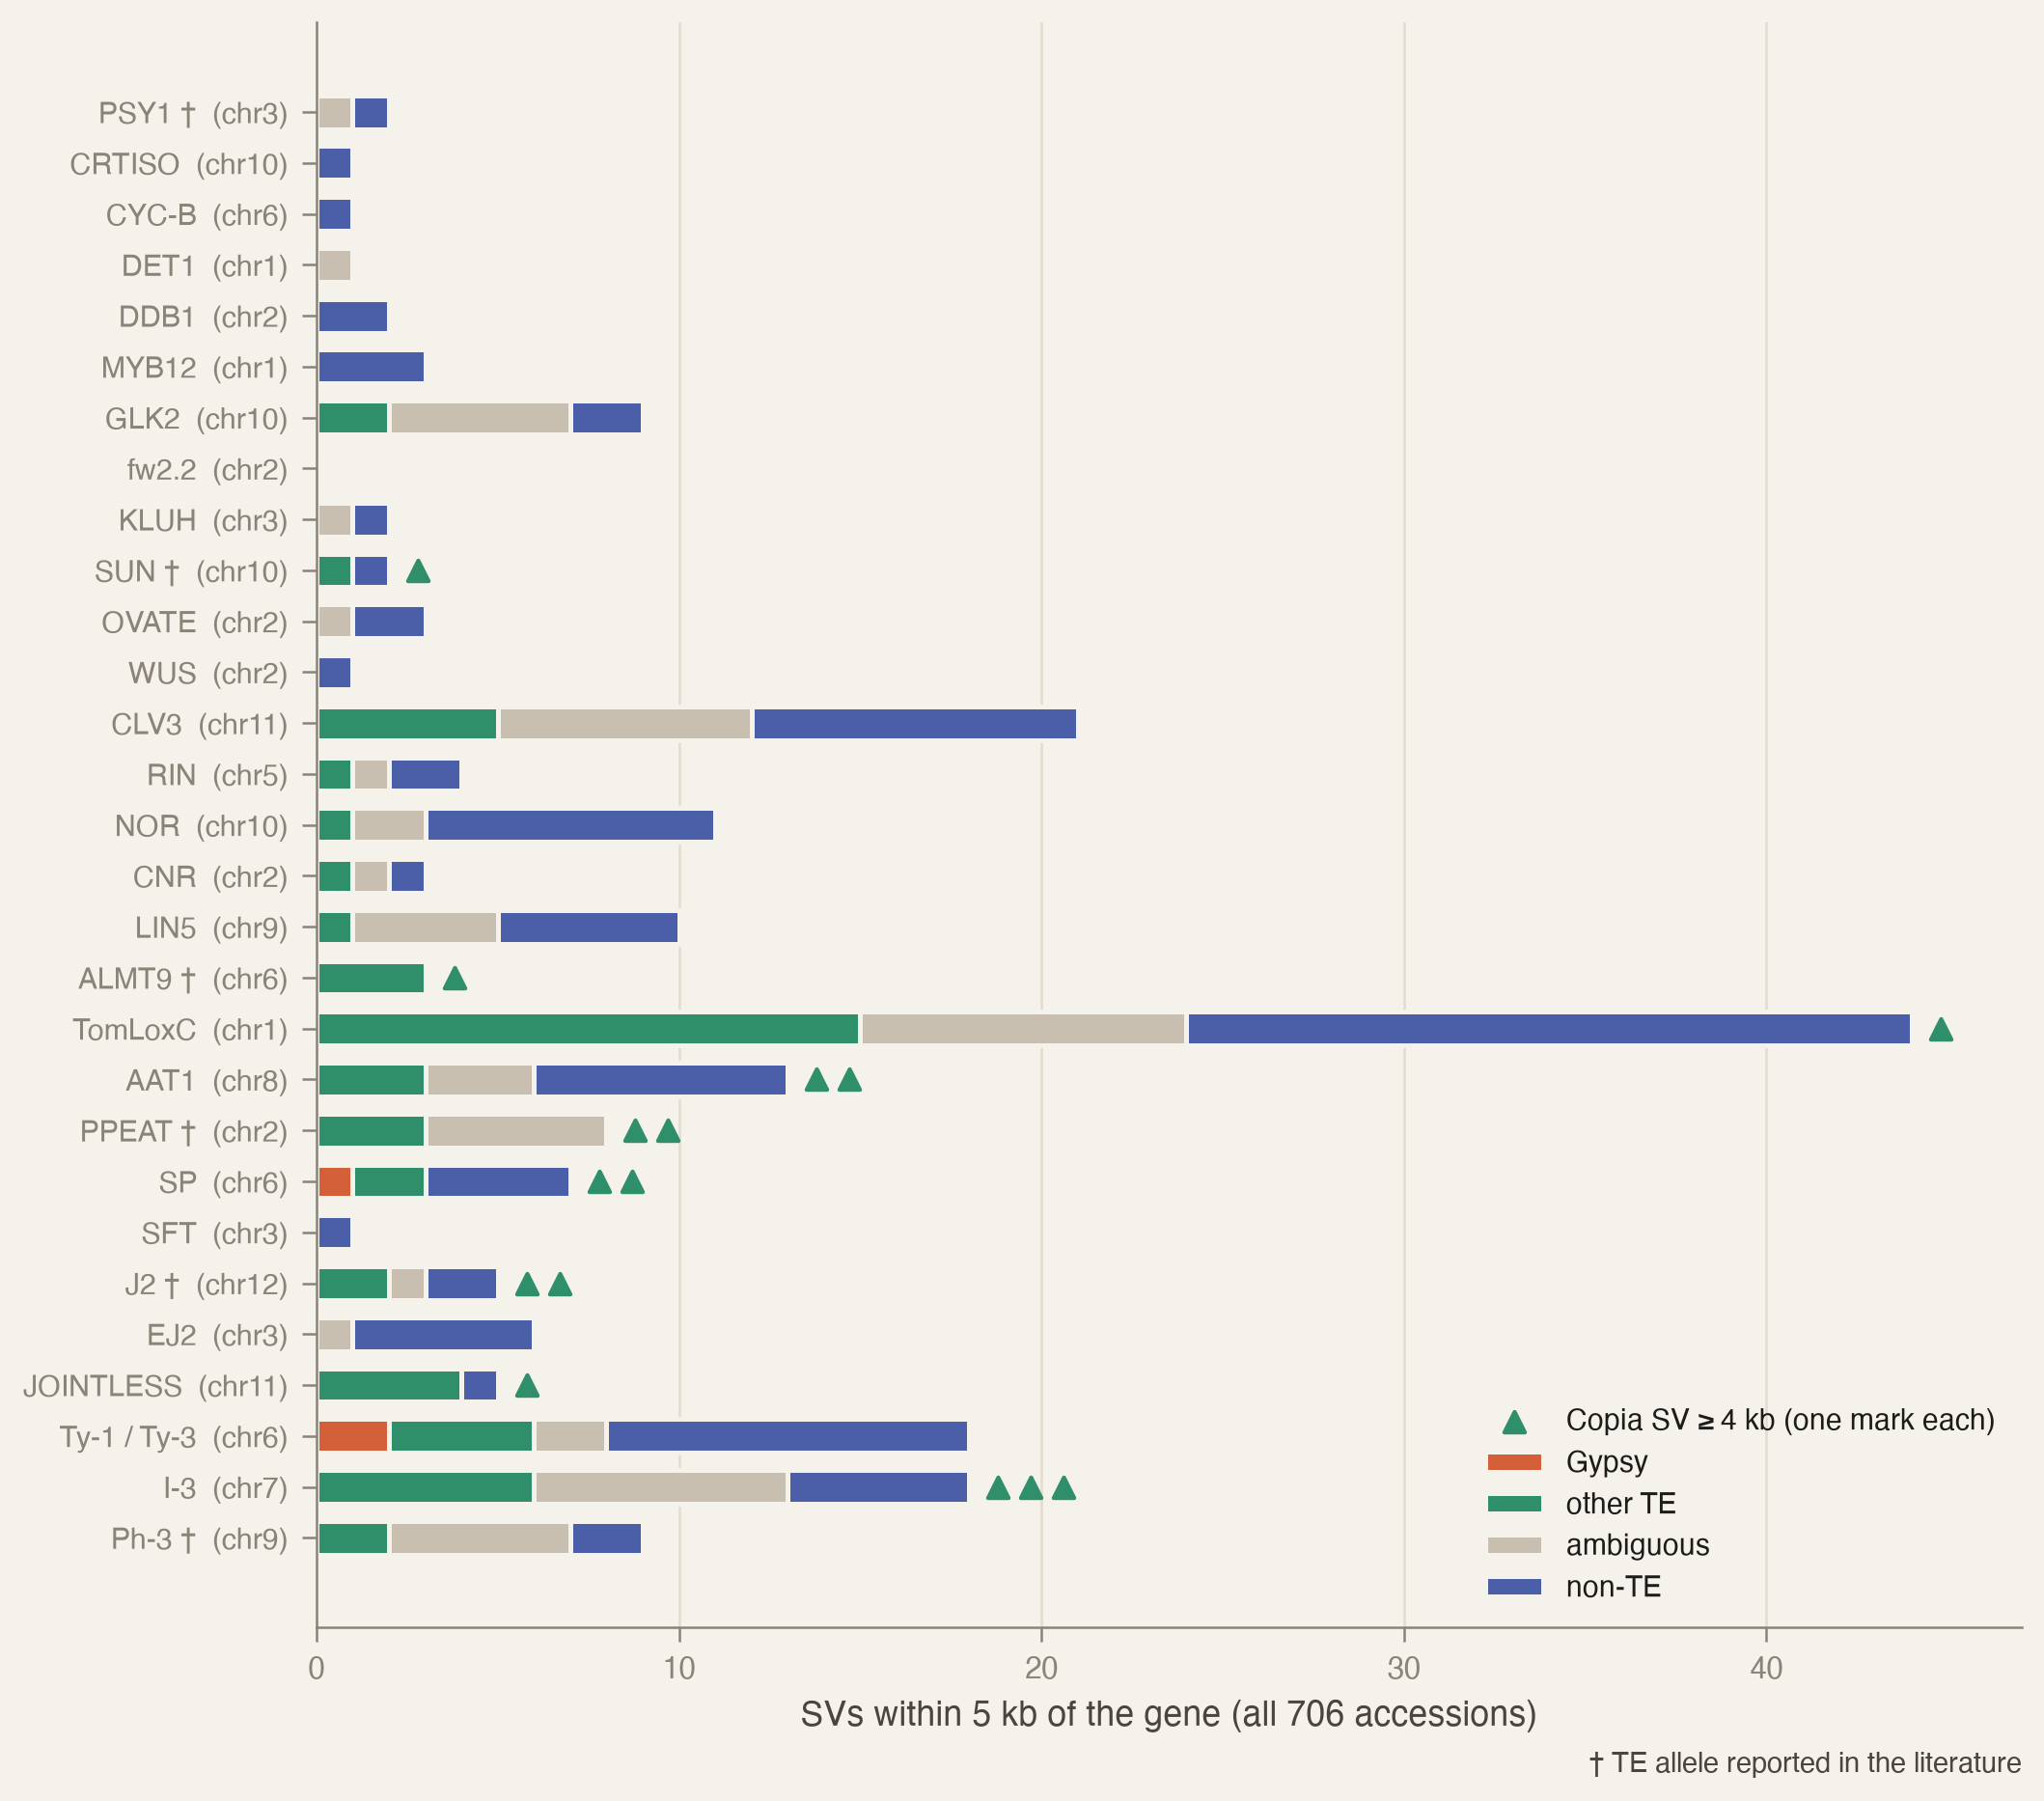
Near known genes. For 29 well-studied genes with verified identifiers — fruit color and size, ripening, flavor, plant architecture, disease resistance — every variant within 5 kb was counted (Extended Data Fig. 4). Complete-length Copia insertions sit near nine, including SUN, J2, PPEAT and I-3; some match transposable-element alleles described before, such as Copia insertions at PPEAT1 and J2, and common Copia variants near Ph-3. At SUN, a 4.9 kb Copia element present in the reference is missing from 78% of accessions; the well-known SUN elongation allele is a separate event, a Rider-driven copy of the gene on another chromosome13, which this count does not test. No transposable-element variant was found near PSY1; the reported insertion there is carried by only 8 of 548 accessions1, rare enough to be missing from the graph's assembled genomes. These are nearby candidates, not causes.
Data availability
All inputs are published: graph-pangenome SV genotypes and SNPs2, short-read TE insertion calls1, long-read SV calls3, and accession metadata4. The numbers behind every figure are committed with the project and readable on this page (“Show the data” under each figure); no genotype-level data is redistributed.
Code availability
The analysis repository is private. The protocol — questions, eligibility, decision rules, thresholds and seeds — is summarized here and recorded in full in the project's stage documents; the pre-registration framework it follows (topos) has its own write-up on this site.
Pre-registration statement
Pre-registered means committed to the project's own repository before scoring, not lodged with an external registry. Five pre-registrations to date: the trait question (stopped by its own power check before scoring), the genotyping gate, the history questions, the element-versus-region test, and the introgression test, stopped by its positive-control gate (0 of 31 known introgressions recovered) before its comparison ran. Analysis grids were frozen and hashed (SHA-256) before results; every question was scored once; the checks that stopped the first design, and a discovery-bias check specified before it ran, are reported above. Deviations are logged in the stage documents.
Competing interests
None.
References
- Domínguez M, Dugas E, Benchouaia M, et al. The impact of transposable elements on tomato diversity. Nature Communications 11, 4058 (2020). doi:10.1038/s41467-020-17874-2.
- Zhou Y, Zhang Z, Bao Z, et al. Graph pangenome captures missing heritability and empowers tomato breeding. Nature 606, 527–534 (2022). doi:10.1038/s41586-022-04808-9.
- Alonge M, Wang X, Benoit M, et al. Major impacts of widespread structural variation on gene expression and crop improvement in tomato. Cell 182, 145–161 (2020). doi:10.1016/j.cell.2020.05.021.
- Lin T, Zhu G, Zhang J, et al. Genomic analyses provide insights into the history of tomato breeding. Nature Genetics 46, 1220–1226 (2014). doi:10.1038/ng.3117.
- Yang J, Manolio TA, Pasquale LR, et al. Genome partitioning of genetic variation for complex traits using common SNPs. Nature Genetics 43, 519–525 (2011). doi:10.1038/ng.823.
- Visscher PM, Hemani G, Vinkhuyzen AAE, et al. Statistical power to detect genetic (co)variance of complex traits using SNP data in unrelated samples. PLOS Genetics 10, e1004269 (2014). doi:10.1371/journal.pgen.1004269.
- Krishna Kumar S, Feldman MW, Rehkopf DH, Tuljapurkar S. Limitations of GCTA as a solution to the missing heritability problem. PNAS 113, E61–E70 (2016). doi:10.1073/pnas.1520109113.
- Hudson RR, Slatkin M, Maddison WP. Estimation of levels of gene flow from DNA sequence data. Genetics 132, 583–589 (1992). doi:10.1093/genetics/132.2.583.
- Yildiz G, Zanini SF, Weber S, et al. Graphical pangenomics-enabled characterization of structural variant impact on gene expression in Brassica napus. Theoretical and Applied Genetics 138, 91 (2025). doi:10.1007/s00122-025-04867-2.
- Scott AJ, Chiang C, Hall IM. Structural variants are a major source of gene expression differences in humans and often affect multiple nearby genes. Genome Research 31, 2249–2257 (2021). doi:10.1101/gr.275488.121.
- Tomato Genome Consortium. The tomato genome sequence provides insights into fleshy fruit evolution. Nature 485, 635–641 (2012). doi:10.1038/nature11119.
- Benoit M, Drost H-G, Catoni M, et al. Environmental and epigenetic regulation of Rider retrotransposons in tomato. PLOS Genetics 15, e1008370 (2019). doi:10.1371/journal.pgen.1008370.
- Xiao H, Jiang N, Schaffner E, Stockinger EJ, van der Knaap E. A retrotransposon-mediated gene duplication underlies morphological variation of tomato fruit. Science 319, 1527–1530 (2008). doi:10.1126/science.1153040.
- Wang Y, Tang X, Cheng Z, Mueller L, Giovannoni J, Tanksley SD. Euchromatin and pericentromeric heterochromatin: comparative composition in the tomato genome. Genetics 172, 2529–2540 (2006). doi:10.1534/genetics.106.055772.